Understanding the complete efficiency picture of electric vehicles

In the fight against global warming, electric vehicles (EVs) are being championed as the future of transportation owing to their impressive efficiency and their ability to be powered by clean sources of energy. Electric vehicles (EVs) typically convert 85-90% of battery energy into motion, compared to just 30% for internal combustion engines [1]. Although this metric works in favour of EVs, it overlooks a critical aspect of the efficiency of the overall energy pathway leading to the utilisation of EVs.
Well to wheel efficiency
To compare the efficiency of EVs and conventional vehicles, we need to examine the complete energy pathway from the source of energy (well) to the motion of the vehicle (wheels), and this metric is termed “well-to-wheel” efficiency. This efficiency paints a more comprehensive picture than a tank-to-wheel efficiency equivalent, which only considers the localised efficiency of the vehicle. There have been plenty of studies on the tank-to-wheel efficiency, but research on estimating the well-to-wheel efficiency has been minimal.
Well-to-wheel efficiency analysis considers five key energy stages:
1. Generation of electricity
2. Transmission of electricity
3. Conversion to mechanical energy
4. Vehicle manufacturing
5. Vehicle maintenance
By computing the energy consumed in each stage and the final energy output at the wheels, we can compare the well to wheel efficiency of conventional vehicles with EVs [2]. Let us now delve into each of the energy consumption stages.
Electricity Generation:
Electricity is by far the most significant factor affecting the well-to-wheel efficiency of EVs. Various sources have different energy conversion efficiencies.
Natural Gas Power Plants: Modern combined-cycle natural gas facilities achieve 48-55% efficiency [3,4,5]. This means for every 2 kWh of natural gas energy consumed via combustion, approximately 1 kWh of electricity is produced, with the remainder lost as heat.
Coal Power Plants: Traditional coal plants operate at 42-46% efficiency [6,7], although advanced technologies, such as supercritical carbon dioxide cycles, can increase this to 51% [8]. On average, producing 1 kWh of electricity expends about 2.22 kWh of energy.
Nuclear Power Plants: Efficiency varies by design—Boiling Water Reactors operate at around 32% efficiency, while Pressurised Water Reactors reach 33-36.5%. Small Modular Reactors with advanced technologies can achieve up to 45% efficiency [9]. The average across nuclear plants is approximately 35%, meaning 2.85 kWh of nuclear energy from fission yields 1 kWh of electricity.
Renewable Sources: Solar, wind, and hydropower differ from the above sources in that they do not involve combustion or the expenditure of heat energy to produce electricity. Instead, renewable energy sources focus on capturing energy sources that are always available (at least within human time scales). While manufacturing and maintenance require energy, these costs become negligible when distributed across the extensive energy produced over their operational lifetimes. This is also consistent with the initial setup and maintenance costs not being included in the sources above. Hence, energy expended for renewable source-based electricity generation is ~0 kWh.
Using these conversion factors, we can calculate the well-to-wheel efficiency for different regions based on their electricity generation mix:
For a region with an electricity generation composition of:
- Natural gas: n%
- Coal: c%
- Nuclear: Φ%
- Renewables: r%
The energy required to generate 1 kWh of electricity would be:
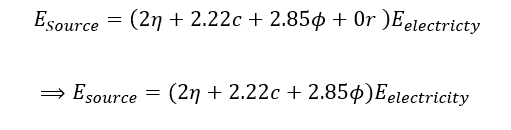
Applying this formula to regional electricity profiles yields significant variations:
- Europe: With 16.8% natural gas, 12.3% coal, 22.9% nuclear, and high renewable penetration (wind: 17.6%, solar: 9.1%, hydro: 11.8%), electricity generation in Europe achieves approximately 52% efficiency [10].
- Australia: Despite generating 46% of its energy from coal, Australia’s sizable renewable energy composition (16% solar, 12% wind, 6% hydro) helps it achieve 49% efficiency [11].
- China: With 60.5% coal dependence offset by 13.2% hydropower, China’s electricity generation reaches about 44% efficiency [12].
- United States: Heavy reliance on natural gas (43.1%), with moderate nuclear (18.6%) and coal (16.2%), results in approximately 39.5% efficiency [13].
- India: Coal-based generation (74.3%) yields an efficiency of around 39.1% [12].
Transmission Losses
Electricity transmission and distribution incur additional efficiency losses. According to U.S. Energy Information Administration data, these losses average about 5% in developed nations. Therefore, for every 1 kWh of electricity delivered to an EV charging point, approximately 1.05 kWh must be generated [14].
Vehicle Energy Conversion
Modern electric vehicles convert about 85% of input electricity into mechanical power [15]. This means 1.17 kWh of electricity is required to produce 1 kWh of mechanical energy at the wheels:

Manufacturing Energy Requirements:
Manufacturing an electric vehicle requires more energy than producing a conventional vehicle, approximately 46,581MJ versus 33,924MJ [16]. This difference is primarily due to battery production, which involves energy-intensive mining and processing of materials like lithium and cobalt.
For a typical EV with a 200,000-mile lifetime, this manufacturing energy amounts to about 12,940 kWh, or 0.065 kWh per mile. While significant, this is dwarfed by operational energy consumption over the vehicle’s lifetime.
Maintenance Energy requirements:
Electric vehicles have lower maintenance requirements than conventional vehicles. They eliminate oil changes and have fewer moving parts subject to wear. Regenerative braking also reduces brake pad wear, further lowering maintenance needs.
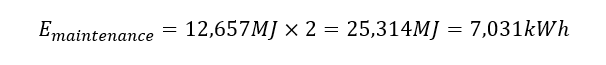
The average battery replacement rate for EVs is once every 75,650 miles [17]. Considering a lifetime utilisation of EVs for 200,000 miles, we can estimate about two battery pack replacements, once at 75,000 miles and another at 150,000 miles.
Lifetime Efficiency Calculation
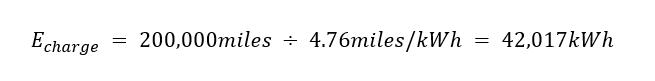
For a typical EV with 200,000-mile lifetime and energy consumption of 4.76 miles/kWh [18], the total energy used for operation is:
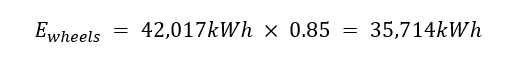
The energy delivered to the wheels (after 85% conversion efficiency) is:
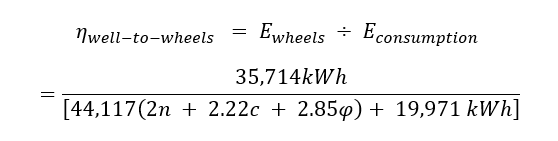
The total energy input required, accounting for electricity generation, transmission, manufacturing, and maintenance is:

Where,

represent the decimal fractions of natural gas, coal, and nuclear in the electricity mix.
The well-to-wheel efficiency is therefore:
Results
Applying this formula to different regions yields the following results.
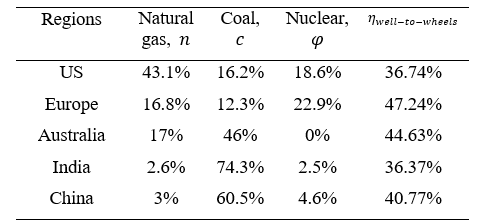
These results portray that even in areas with the lowest calculated efficiency (around 36%), electric vehicles still outperform conventional vehicles for which the same well to wheels efficiency is about 20.5% [2]. This advantage stems from two fundamental factors:
1. The inherent efficiency advantage of electric motors over internal combustion engines
2. The higher efficiency of centralized power generation compared to distributed combustion in individual vehicles
Power plants can implement technologies like waste heat recovery and operate at higher temperatures and compression ratios than vehicle engines, making them inherently more efficient at converting fuel to usable energy [19]. These advantages persist regardless of the fuel source.
The analysis also reveals that regions with higher renewable and nuclear energy penetration achieve significantly better well-to-wheel efficiency. Europe’s 52% efficiency represents the current global benchmark, achieved through a balanced mix of nuclear power and renewables.
Conclusions
1. Regional variation: An EV’s efficiency varies by location based on the local electricity generation mix, though it remains a cut above to conventional vehicles in all regions studied.
2. Renewable transition: As electricity grids incorporate more renewable energy, the well-to-wheel efficiency of EVs improves accordingly, creating a compounding benefit.
3. Impact of Battery replacements: While EVs need about two battery replacements for a 200,000-mile lifetime utilization, this can still be justified on the account that the well to wheel efficiency remains significantly better than conventional vehicles.
4. Maintenance advantage: EVs require significantly less energy for maintenance over their lifetimes, further enhancing their efficiency advantage.
The data demonstrates that electric vehicles represent a substantial efficiency improvement over conventional vehicles regardless of location. However, the magnitude of this advantage (ranging from 36% to 52% depending on region), highlights the importance of simultaneous investment in clean electricity generation alongside EV adoption.
For policymakers, this analysis underscores the value of coordinated approaches that combine transportation electrification with grid decarbonization. For consumers, it confirms that EVs offer significant efficiency benefits regardless of local electricity sources, with these benefits increasing as grids become cleaner.
As renewable energy capacity continues to expand globally, the well-to-wheel efficiency of electric vehicles will improve accordingly, further widening their advantage over conventional vehicles and accelerating the transition to more efficient, sustainable transportation.
About the authors

Prajwal Chinthoju is an autonomous driving engineer at Aptiv PLC USA. He holds a Master’s degree from UIUC and a Bachelors in Technology degree from IIT Madras.

Raksha Vashishta is a product owner at Verra Mobility and her expertise spans end-to-end product development, with a particular focus on implementing data-driven decision frameworks and user-centered design methodologies.
The work referenced in this article was performed in collaboration with Raksha Sreenath Vashishta, and Ravi Jagirdar [20].
References
[1] František Synák et al. “Assessing the Energy Efficiency of an Electric Car.” Communications, 23 (2020).
[2] Chinthoju, Prajwal Kumar, Raksha Sreenath Vashishta, and Ravi Jagirdar. “Well-to-Wheels Efficiency Analysis for Plug-in Hybrid Electric vehicles.” Journal of Engineering Research and Reports 27.3 (2025): 328-340.
[3] Xiang, Y., et al. (2018). Study on the configuration of bottom cycle in natural gas combined cycle power plants. Applied Energy, 212, 465-477.
[4] Amann, J., et al. (2009). Natural gas combined cycle power plant modified into an O₂/CO₂ cycle for CO₂ capture. Energy Conversion and Management, 50, 510-521.
[5] Ting, L., et al. (2025). A novel post-combustion CO₂ capture process for natural gas combined cycle power plant. Energy.
[6] Zhang, H., et al. (2024). Efficiency improvement for coal-fired power plants by H₂/O₂ combustion. Journal of Energy Storage.
[7] Fu, C., et al. (2015). Thermal efficiency of coal-fired power plants: From theoretical to practical assessments. Energy Conversion and Management, 105, 530-544.
[8] ZhaoFu, W., et al. (2022). The roadmap towards the efficiency limit for supercritical carbon dioxide coal fired power plant. Energy Conversion and Management.
[9] Abedin, M., et al. (2023). Efficiency analysis of nuclear power plants: A comprehensive review. World Journal of Advanced Research and Reviews.
[10] European Electricity Review (2024). Share of EU electricity generation, by source (%).
[11] Australian Government, Energy Generation Statistics (2023). Electricity generation.
[12] Yearly electricity data (2016). Ember.
[13] U.S. Energy Information Administration (2024). Electric Power Monthly, February 2024.
[14] Energy Information Administration (2024). Annual electricity transmission and distribution losses.
[15] Sweeting, W., Hutchinson, A., & Savage, S. (2011). Factors affecting electric vehicle energy consumption. International Journal of Sustainable Engineering, 4, 192-201.
[16] Sullivan, J. L., Burnham, A., & Wang, M. (2010). Energy-consumption and carbon-emission analysis of vehicle and component manufacturing. Argonne National Laboratory.
[17] Liu, H., Deng, Z., Yang, Y., Lu, C., Li, B., Liu, C., & Cheng, D. (2023). Capacity evaluation and degradation analysis of lithium-ion battery packs for on-road electric vehicles. Journal of Energy Storage.
[18] Martin, et al. (2024). Energy consumption of electric vehicles.
[19] Huang, B., et al. (2022). Life cycle cost analysis of solar energy via environmental externality monetization. The Science of the Total Environment.
[20] C Chinthoju, Prajwal, Raksha Vashishta, and Ravi Jagirdar. “Powering the Future: A Global Analysis of Well-to-Wheel Efficiency in Electric Vehicles.” Journal of Engineering Research and Reports 27.4 (2025): 10-9734.
Also read: Detailed electric vehicles glossary
Subscribe & Stay Informed
Subscribe today for free and stay on top of latest developments in EV domain.